As mentioned before, last Summer I was involved in designing and creating Points Calculator – Ireland – a fabulous iThing app that everyone who ever has or ever plans to sit the Leaving should download forthwith, regardless of whether or not they have an iThing to play with it on. 😉
This post is about ways I monitor the ongoing performance of the app, and may be of interest to anyone thinking of launching an app themselves.
Apps for Apps
The first way I monitor our app is by using the following two apps:
- ITC Mobile by Apple
- PositionApp™ by ustwo™
ITC Mobile
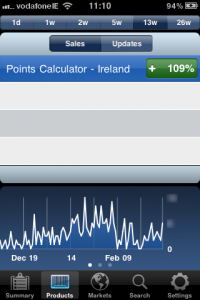
 This app is provided by Apple, and allows registered app developers to check their sales figures for different timeframes covering the preceding 26 weeks (for the preceding day only, or for the preceding 1, 2, 5, 13 or 26 weeks).
Figures are updated once a day (around 1pm Irish time), and you can choose to see your stats broken down in a variety of ways:
- Sales of all Paid Apps
- Sales of all Free Apps
- Stats for in App purchases
- Stats for updates rather than new downloads
- Stats by product (new sales or updates)
- Stats by market (new sales or updates)
Tapping the number of sales/updates in each view cycles though:
- the absolute number of sales/updates for the period
- the trend for the period, as a positive or negative number
- the trend for the period as a positive or negative percentage
A graph at the bottom of each screen gives a more visual representation of the same information, and turning your iThing to landscape orientation presents just the graph in a full screen view.
It’s a nice little app, and since the numbers come straight from Apple you can have faith in the accuracy of what it tells you. We saw an expected peak of downloads between LC results and the week of CAO offers, then an unexpected jump around Christmas and New Year, presumably indicating that a fair number of LC students got iThings for the first time as presents or in the sales.
PositionApp

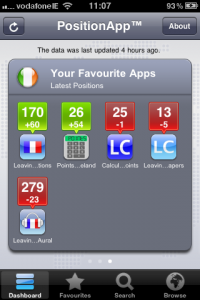
This is a paid app, but I’ve had hours of entertainment from it so found it worth the small cost. It highlights the movers and shakers in the iTunes App Stores, giving current ranking and relative movement in the charts.
Default views are of the Top 100 and Top 300 apps in all genres, and there’s a customisable page for your own list of favourite apps, which can be any apps at all from the iTunes iPhone App Store (at the time of writing they don’t monitor stats for the iPad App Store), so it’s a nifty way to keep track of your competition or random apps you’re interested in.
I track our app and other similar and dissimilar apps in the Irish Education market. In the past week, I see that several education apps I’m monitoring have suddenly reappeared on the radar after an absence of several months, from which I’m inferring that students are suddenly downloading relevant education apps in a bit of a pre-mocks panic.
Other Ways to Monitor your App
Aside from the apps above, I also have Google Alerts set up to let me know whenever our app gets a mention, and I check periodically in the iTunes App Store.
Google Alerts

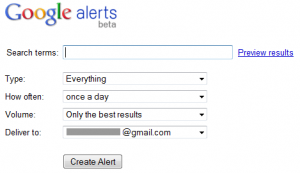
Google Alerts allows you to configure searches that Google will perform automatically. New results that match your criteria can be mailed to you, or added to a feed in Google Reader. You can restrict the types of results Google returns for your keywords, for example by saying you only want to see news stories or blog posts featuring your terms. You can also specify that you want to get results immediately as new matches appear, or at daily/weekly intervals.
As with the PositionApp, I use alerts to monitor mentions of our app, our competitors’ apps, and LC points calculators generally.
Timing is Everything
As far as I can tell from the alerts I’ve been receiving, they seem to be sent at the same time of day that you create them, so bear this in mind when you’re configuring an alert and set it up at the time of day you’ll get most benefit from receiving the updates.
App Store(s)
It’s worth having a look at the iTunes App Store from time to time too to see how your app is doing.
When you go into the apps section, you can choose to view iPhone or iPad apps, and each has different listings and a different chart, so if your app is available on both platforms, check both charts. Our app ranked higher for longer in the iPad chart than in the iPhone chart, most likely due to the lower number of apps in our category rather than absolute numbers of downloads.
![]() You can also view charts for different countries by scrolling right to the end of the iTunes Store screen, clicking the little circular flag icon and selecting the flag for another country from the next screen that appears.
You can also view charts for different countries by scrolling right to the end of the iTunes Store screen, clicking the little circular flag icon and selecting the flag for another country from the next screen that appears.
